

Always-On Incrementality Testing
Measure the true incremental impact of your marketing spend
Geo-based experiments that separate causation from correlation. No more guessing if your ads actually drove the sale.
Oops! Something went wrong while submitting the form.

Platform-reported ROAS is lying to you.

Correlation ≠ Causation
A customer clicked your ad before purchasing. Did the ad cause the sale, or were they buying anyway? Google says 4x ROAS. Reality might be 1.2x. Or 6x. The only way to know: run a controlled experiment.
Missing the Halo Effect
Your YouTube awareness campaign drove purchases with no click attribution. Traditional tracking misses this entirely, those conversions get credited to "Direct" or another channel.
Privacy is Breaking Your Pixels
iOS changes, cookie deprecation, declining consent rates. Your pixel data gets less accurate every quarter. You're flying blind on what's actually working.

What’s the true impact of your marketing spend?
For example, just because a customer clicked on an ad before purchasing doesn’t necessarily mean the ad caused the purchase. In reality, they might have been planning to buy anyway, making the ad more of a coincidence than a driver of sales.
On the other hand, your Youtube awareness campaign drove purchases with no click attribution.
On the other hand, your Youtube awareness campaign drove purchases with no click attribution.
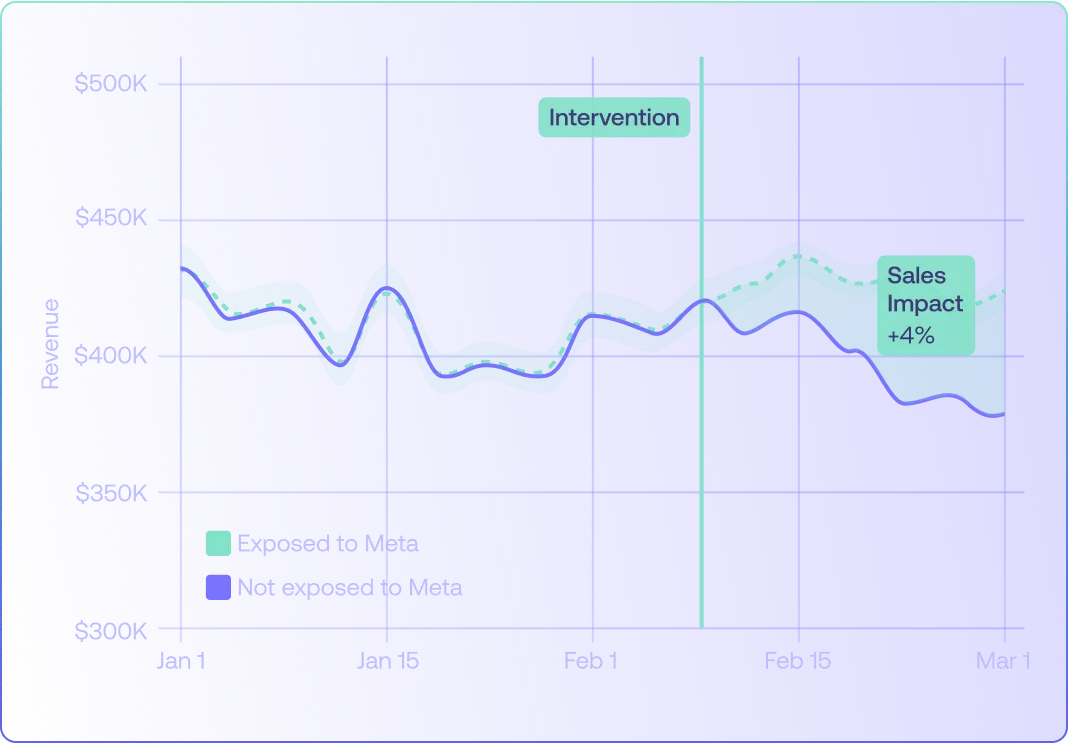
Geo-based scientific experiments
Compare outcomes between regions exposed to marketing and unexposed control regions. Isolate real impact from noise (trends, seasonality, etc).
We don't just compare California to Texas, that's naive. We build a "synthetic control": a mathematical blend of holdout regions weighted to mirror the treatment group's historical behavior.
We don't just compare California to Texas, that's naive. We build a "synthetic control": a mathematical blend of holdout regions weighted to mirror the treatment group's historical behavior.

How it works
1
We analyse your historical sales and provide a comprehensive experiment design and simulation: geographical regions selection, duration and results accuracy range.
2
We implement the geographical targeting of the campaigns you want to test.
Most geo-tests assume perfect isolation. Reality: ad platforms leak. Our first-party pixel measures exactly how much campaign traffic bleeds into control regions — then adjusts the model.
Most geo-tests assume perfect isolation. Reality: ad platforms leak. Our first-party pixel measures exactly how much campaign traffic bleeds into control regions — then adjusts the model.
3
You can monitor the results in our report and uncover the incremental conversion value, true CAC and ROAs of your campaigns.
See how viable your test is
Use the calculator to estimate how long to run your test, and what confidence level you can expect.
Most tests assume stable, consistent spend throughout the test period. Reality: ad platform delivery fluctuates daily. Our model accounts for these variations rather than ignoring them.
Most tests assume stable, consistent spend throughout the test period. Reality: ad platform delivery fluctuates daily. Our model accounts for these variations rather than ignoring them.


Supported platforms
Causal Lift supports Google Ads, YouTube, Meta, TikTok (US) and TV. You can test a single campaign or a group of campaigns together.
Sales can be measured across Shopify, Amazon and physical stores.
Sales can be measured across Shopify, Amazon and physical stores.
Proven 20% higher precision over Meta GeoLift

The Polar Causal Engine
Proprietary research — not an open-source package with default settings.

Behavioral Clustering
Group regions into clusters by seasonality and volatility — not just geography.
.svg)
Time-Weighted Adaptation
Exponential weighting prioritizes recent trends over stale historical patterns.

Decidability First
Architecture minimizes variance, ensures clear "Yes/No" results — not "directionally positive."
Case studies & resources
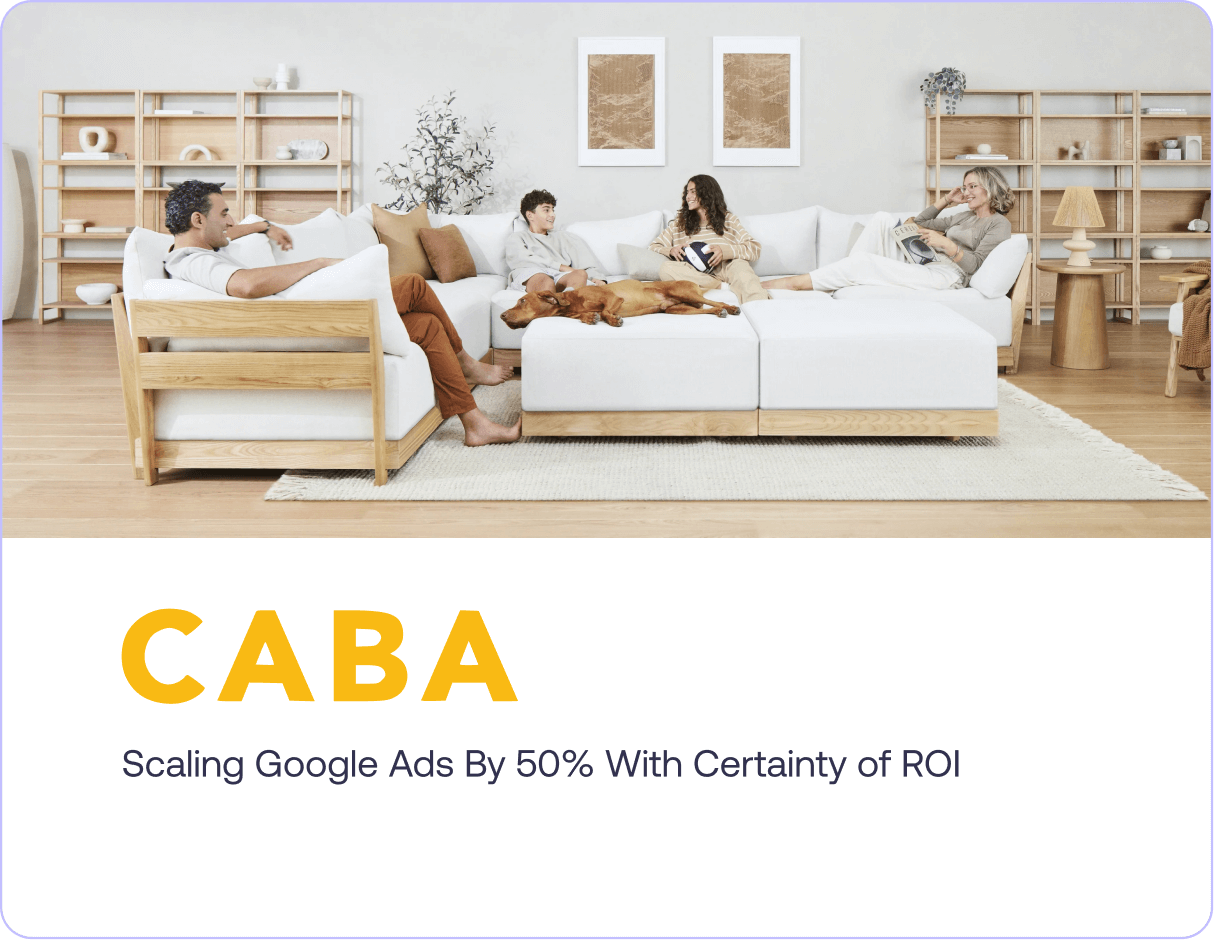
Can we scale Google Ads profitably before committing?
How CABA Design Co. Scaled Google Ads By 50% With Certainty of ROI

Is Google Brand cannibalizing organic?
How The Feed optimized brand search efficiency with Polar Analytics’ incrementality testing.
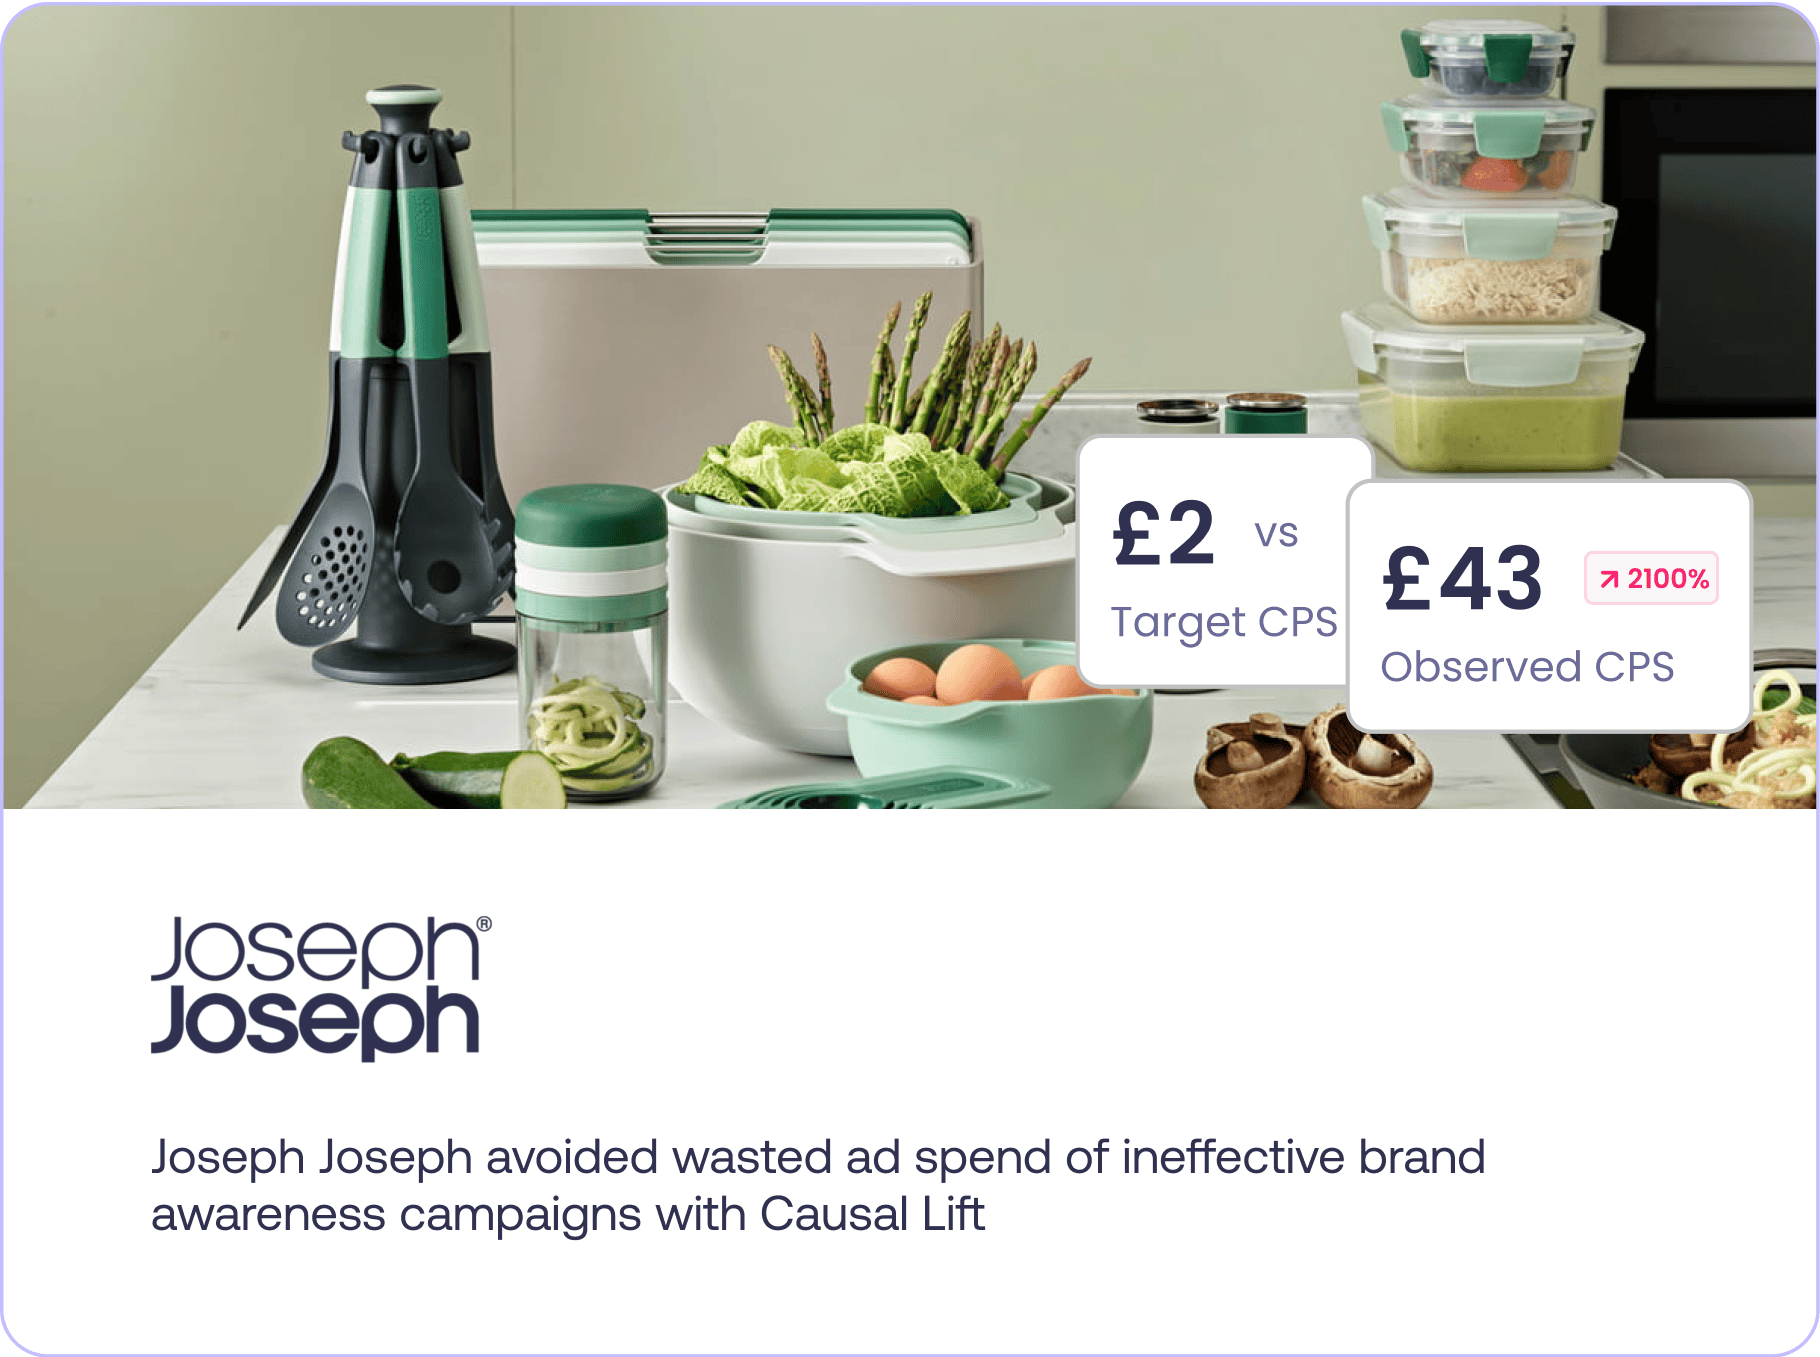
What's the true incremental lift of BoF vs ToF?
How Joseph Joseph used Causal Lift to evaluate a new Meta reach campaign.

Why Most Geo Tests Fail and How to Design One for Reliable Results
How to design smarter, simulation-backed experiments that deliver confident, decision-ready results.
Polar vs. Haus.io
Polar vs. Haus.io
Polar Analytics
Triplewhale
Handling Ad Leakage
✓ Measures & adjusts
Our pixel detects how much ad traffic bleeds into control regions, then corrects the model
Our pixel detects how much ad traffic bleeds into control regions, then corrects the model
Prevents upfront
Uses "Commuting Zones" to group regions by mobility patterns
Uses "Commuting Zones" to group regions by mobility patterns
Spend Fluctuations
✓ Accounts for variance
Daily spend changes are factored into lift calculation for higher precision
Daily spend changes are factored into lift calculation for higher precision
Assumes stability
Typically measures against consistent spend levels
Typically measures against consistent spend levels
Data Connection
✓ Already integrated
First-party pixel + platform APIs come pre-connected
First-party pixel + platform APIs come pre-connected
Bring your own
Connects to your data warehouse with aggregated geo-spend
Connects to your data warehouse with aggregated geo-spend
Who Runs the Test
✓ We do
Scoped, executed, and interpreted by a Polar data scientist
Scoped, executed, and interpreted by a Polar data scientist
You do
Self-serve platform for internal marketing science teams
Self-serve platform for internal marketing science teams
What You Get
✓ Recommendations
Daily dashboard + expert synthesis with clear Scale/Cut decision
Daily dashboard + expert synthesis with clear Scale/Cut decision
Dashboards
In-platform reporting with AI summaries
In-platform reporting with AI summaries
Price pert test for a $50m brand
$5,000
(Bundling option with as part of the Polar Data Platform available)
(Bundling option with as part of the Polar Data Platform available)
$20,000
(No bundling option, solo-product offering)
(No bundling option, solo-product offering)